CIP automation is the use of a control system to run clean-in-place cycles automatically, sequencing pre-rinse, caustic wash, intermediate rinse, acid wash and final rinse through the sensors, valves and logic that make each cycle repeatable and verifiable. It cleans process equipment in place, without dismantling it, which is what separates it from clean-out-of-place (COP), where parts are removed and washed separately. Metromotion Controls is a control systems integrator based in Mount Waverley that delivers CIP automation across Melbourne, Victoria and Australia for dairy, beverage and food plants.
CIP is one of the largest controllable cost centres in a food or beverage plant. Chemicals, trade waste fees, audit effort, equipment time and mechanical wear are paid for whether the cycle was efficient or not, and the control layer is where many of those costs can be reduced without replacing sound stainless steel. This article focuses on where CIP automation usually pays back: endpoint-driven phase control, digital records, scheduled queues, coverage verification, and better handling of the mechanical stresses that high-velocity cleaning creates.
This post supports our food and beverage automation Australia, dairy automation Australia and industrial automation Melbourne pages. It explains the CIP control work that improves an existing system rather than replacing it.
1. Cycle optimisation for trade waste, chemical, and time
Most CIP cycles on Australian food sites run longer than they need to, usually because phases are time-driven rather than endpoint-driven. A pre-rinse runs for a fixed five minutes regardless of when product residue has cleared. A caustic wash runs a fixed time regardless of when conductivity confirms working strength. A final rinse runs to a timer set conservatively at commissioning and never reviewed.
Each over-run costs three things at once:
- Trade waste. Australian water utilities charge trade waste on volume and chemical load. Every extra minute of rinse adds to the effluent that has to be treated and discharged, and to the chemical content the trade waste agreement is priced against.
- Chemicals. Caustic, acid and sanitiser cost money per cycle. Cycles that run longer than the chemistry requires consume more chemical without improving the clean.
- Equipment time. Every minute a vessel or line is in CIP is a minute it is not producing. On sites running CIP several times a day, even a few minutes saved per cycle adds up to meaningful production time recovered across a week.
Endpoint-validated phases produce shorter, more consistent cycles. A pre-rinse ends on conductivity dropping to a product-out threshold. A caustic wash ends on conductivity confirming concentration and temperature confirming thermal performance. A final rinse ends when return conductivity returns to the incoming water baseline. Whether a cycle can be optimised this way depends on the control layer, the PLC, SCADA and HMI logic that reads the instruments, sequences the valves and ends each phase on a measured result. The conductivity or temperature reading that ends a phase is also the record that proves the phase reached specification.
Pre-rinse control protects the chemical tanks
Pre-rinse control is not only a water and time decision. Its first job is to keep product carryover out of the chemical recovery system. If product is returned into a caustic or acid tank, it can foul the tank, consume chemical strength and weaken later washes, leaving the site with a difficult choice: keep running questionable washes through the rest of the plant, or dump and recharge chemical that should have stayed usable.
Automation reduces that risk by basing the return-to-drain and return-to-tank decision on the measured state of the rinse rather than a fixed timer. Conductivity, turbidity where available, route selection and endpoint logic hold pre-rinse to drain until product carryover is low enough to protect the recovered chemical. The saving is not only the water avoided at the start of the cycle. It is the chemical tank that did not have to be dumped and the later washes that stayed within specification.
What actually does the cleaning: the TACT model
Endpoint-driven control only works if it is anchored to the chemistry it measures. CIP chemistry is usually described with the TACT model: Time, Action, Concentration and Temperature. Cleaning effectiveness is the product of those four factors, and they trade off against one another. A weaker concentration can be offset by a higher temperature or a longer contact time; a lower temperature by stronger chemistry or more mechanical action. There is no single correct setting, only a recipe that balances the four for a given soil and circuit.
Temperature carries more weight than its position in the list suggests, because it drives reaction rate. A common rule of thumb, from the Arrhenius relationship, is that the rate of a chemical reaction roughly doubles for every 10 degrees Celsius rise. That is why caustic washes are run hot, and why holding temperature for the whole wash, rather than touching it briefly at the start, is what the record has to prove.
As a general industry reference, not a Metromotion Controls measurement, the typical chemistry ranges are:
| Phase | Typical chemistry (industry guidance) | Typical temperature | Target |
|---|
| Caustic wash | Sodium hydroxide (NaOH) about 1 to 4% | about 65 to 80 degrees Celsius | Organic soils, fats, proteins |
| Acid wash | Nitric or phosphoric about 0.5 to 1.5% | warm | Mineral scale, milkstone, beerstone |
| Sanitiser | Peracetic acid about 100 to 200 ppm | cold | Final microbial reduction |
These figures are typical starting points only. The correct concentration, temperature and time for any circuit depend on the soil, the surface finish, the water chemistry and the chemical supplier's recommendation, and should be confirmed for the specific application rather than carried across from another plant. What the control system contributes is holding whatever recipe is agreed to its target and proving on the record that each of the four TACT factors was met.
Flow velocity: the factor that is easy to under-provide
The A in TACT, mechanical action, is delivered inside pipework by turbulent flow. Laminar flow slides past the pipe wall and cleans poorly; turbulent flow scours it. The widely cited industry target is a velocity of at least around 1.5 metres per second in the return line, which puts the Reynolds number well into the turbulent regime for typical CIP solutions and line sizes.
This is where a circuit most often falls short in practice. A return pump sized for the easiest path, or for the circuit as originally built before branches were added, cannot sustain 1.5 m/s once flow has to be shared. Flow takes the lower-resistance route, the favoured leg gets more than its share, and the higher-resistance branches are starved below the velocity at which they clean. The record still shows a completed cycle, because the instruments near the pump saw good flow. The starved branch did not. Sizing the supply and return pumps for the worst-case branch, not the average, is the design decision that prevents this, and it is the same failure mode that coverage verification is there to catch when it slips through.
Water hammer during CIP: small shocks become real cost
CIP often runs at higher velocity than production, so the hydraulic system can be less forgiving during cleaning than during normal transfer. Abrupt pump stops, fast valve closure and poor pump-valve sequencing can create pressure shocks that repeat every wash. One event may not break the plant. Repeated shocks cost money as seals, sanitary gaskets, valve actuators, instruments, check valves, clamps and pipework take stress cycle after cycle.
The control response is to give CIP its own ramp and sequencing rules: separate pump acceleration and deceleration parameters, slower valve closure where needed, pump-down-before-valve-close sequencing, low-speed thresholds before route changes, and fault handling that avoids snapping a moving column of liquid against a closed path. The same control discipline used for pump control and water hammer on hygienic lines belongs in CIP logic as well.
2. Digital records for audit
CIP records are evidence. Under the Food Standards Australia New Zealand (FSANZ) framework, food businesses are expected to demonstrate that cleaning and sanitation are effective and controlled. A food safety auditor reviewing a recall, a customer reviewing a hygiene complaint, and a quality team investigating a contamination event all need the same thing: the ability to retrieve exactly what happened on a specific cycle. Start and stop timestamps do not provide that. The time-series data that shows the conditions present throughout the cycle does, the kind of historian and reporting data our industrial data and IIoT work captures and trends.
| Data captured | What it shows |
|---|
| Conductivity trend through each phase | Chemical concentration was at working strength when it needed to be |
| Temperature trend through caustic and acid phases | Thermal performance was maintained across the cycle |
| Flow rate trend | Adequate turbulence was present throughout, not only at the pump |
| Phase start, end, and duration | Sequence completed in the expected order with expected timing |
| Recipe identifier and version | The cycle ran the parameters that were approved for that circuit |
| Operator ID and any manual intervention | Any deviation from automatic operation is traceable |
Captured per cycle, this is the data a quality team or an auditor can rely on when a record is challenged.
3. Scheduling and queueing CIPs back to back
On many older CIP systems, an operator has to be present at the end of each cycle to start the next one. Cycles finish while the operator is occupied elsewhere, so the next one starts late. Ten minutes between one wash and thirty before another can compound into hours of avoidable downtime across a busy week, especially when CIP sets are a production bottleneck.
Queueing addresses the handover problem. Operators set up equipment for CIP and add washes to the system, then the control system washes circuits sequentially without an operator waiting at every transition. Each circuit still runs its own recipe and produces its own record, but the dead time between washes is removed.
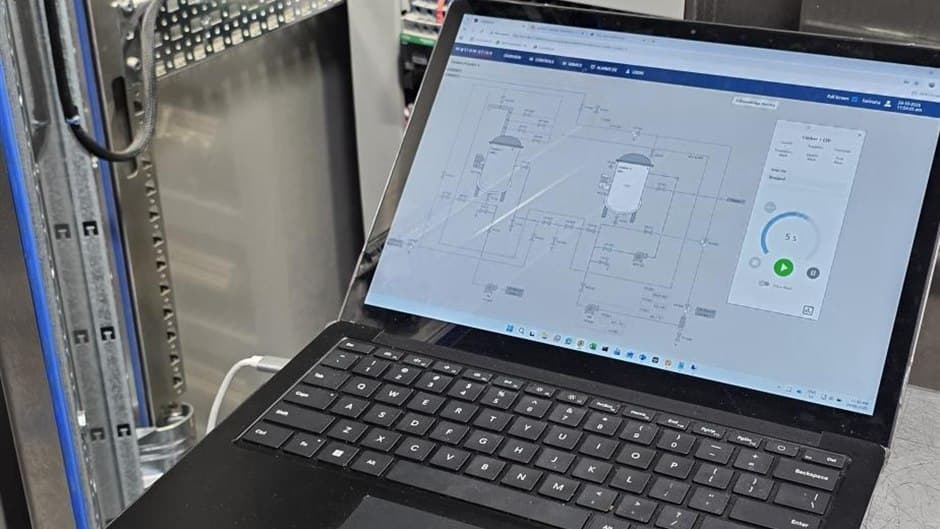
Scheduling is the next layer. Sites with many vessels, fillers, transfer lines or process areas need to coordinate production demand against shared CIP services. Historical wash times, resource visibility and equipment release states help the team see when a CIP set, chemical supply, return tank or shared route will be available, instead of making those decisions from radio calls and whiteboards.
Capability checklist for scheduling and queueing CIP
- Recipe-driven wash definitions per circuit.
- Resource locking for CIP sets, chemical supply, return tanks, transfer valves and shared routes.
- Equipment readiness and release confirmation before each wash.
- Historical wash-time estimates shown on an HMI or SCADA schedule screen.
- Queue controls to add, hold, reorder, cancel and recover from faults.
- Per-cycle logging so every queued wash still has its own audit record.
Queueing turns CIP from a process that needs an operator at every transition into one the operator schedules and supervises. Scheduling gives production and hygiene teams a clearer view of when shared services free equipment up again.
4. Coverage verification
The most dangerous CIP failure mode is the cycle that completes successfully but did not actually clean every path. The sequence ran. The conductivity endpoint was met somewhere in the circuit. A leg with a partially closed valve, a blocked return line, or a parallel branch starved because the circuit short-circuited through a lower-resistance path never saw the chemical at working concentration. The record looks good. The leg is dirty.
Coverage verification means designing the control system so every leg of the circuit has to prove it was washed before the cycle is allowed to report complete:
- Flow switches or flow meters on return paths. A flow signal at each leg's return confirms that flow actually reached the end of the leg.
- Conductivity probes at branch ends. A reading at the far end of a branch confirms the chemical or rinse reached there at concentration, not only at the start of the loop.
- Sequenced valve verification. The control logic confirms each valve opened and closed in the expected order, using feedback from limit switches alongside the command.
- Failure-to-complete logic. If any leg fails its verification, the cycle does not report complete. It reports a coverage fault that requires investigation and rework. There is no silent pass.
Without explicit per-leg verification, a partial wash is indistinguishable from a full one in the batch record, so a coverage problem only surfaces later as a downstream contamination or audit finding. CIP automation pays back across all of these fronts at once: the avoided chemical dump, the handover that did not hold up the next wash, the audit record that answered the question quickly, the poor wash that did not pass silently, and the pressure shock that did not keep loading seals, valves and pipework, all made visible and controlled by the control layer.