Platforms and vendors
- Power meters
- Water, gas and steam meters
- Modbus and EtherNet/IP
- Ignition
- SQL databases
- Power BI integration
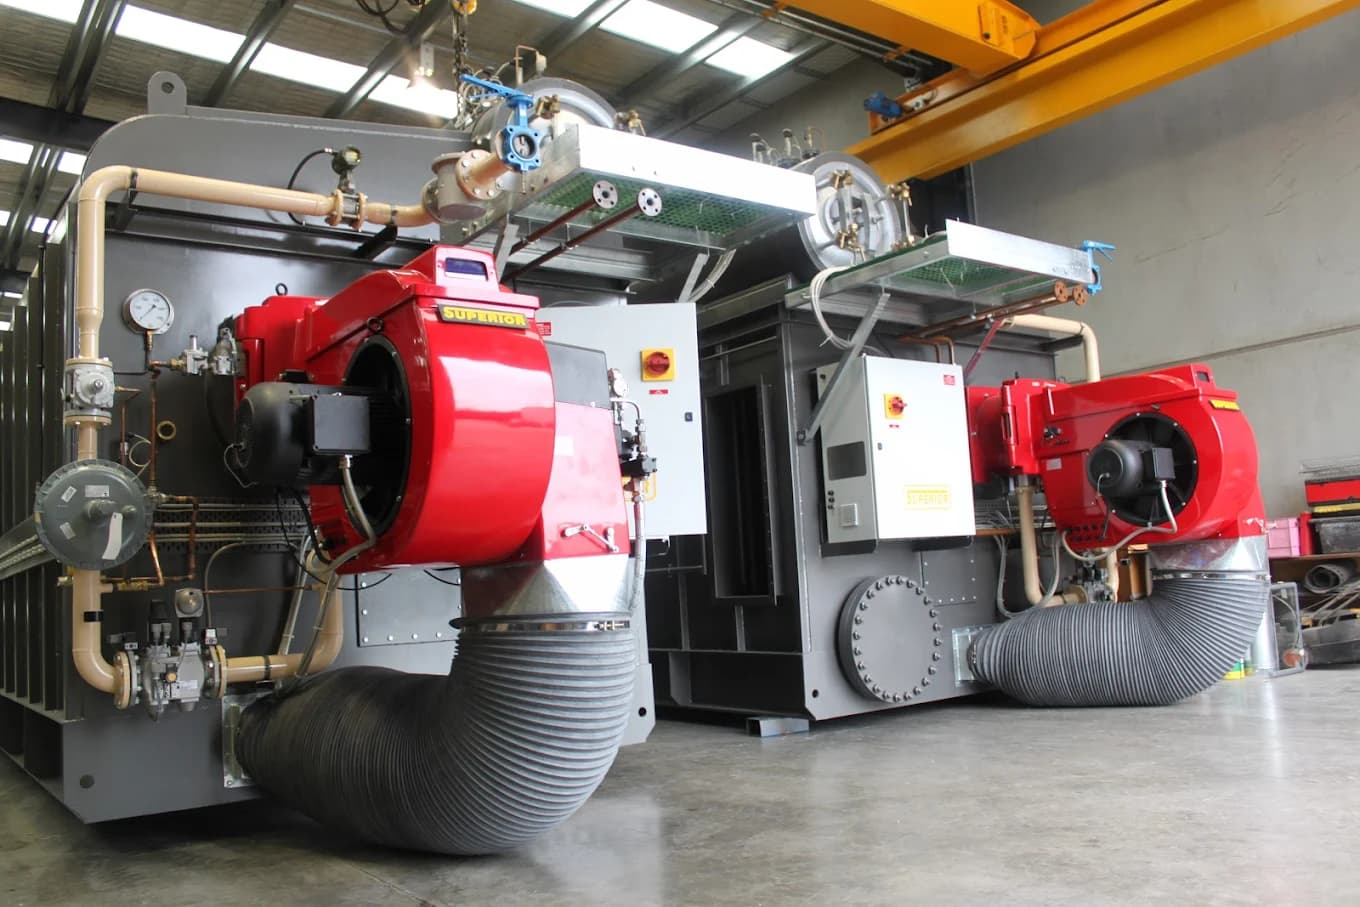
Metromotion Controls brings electricity, water, gas, steam and compressed air metering onto the control network and reports it next to production, so utility use can be seen by line and shift and read against what the plant made.
Utilities are one of the largest controllable costs in a food plant, and in many sites they are read monthly from the bill. The meters, boilers, compressors and refrigeration plant are usually already connected to a PLC somewhere. Metromotion Controls connects them to the same data layer as production, so energy and water can be seen by area, line and shift, and read against output. At Chobani, the plant services scope we support includes boilers, refrigeration, trade waste, power monitoring and water usage monitoring.
Most sites already have more meters than they read. Main incomers, sub-boards, flow meters and gas meters often have a communications port that nobody has connected. We bring them onto the control network over Modbus, EtherNet/IP or the protocol they support, add sub-metering where an area or line cannot be separated, and store readings in the same data layer as production.
A kilowatt-hour figure means little on its own. Beside production counts, the same data shows how utility use moves with output, product mix, changeovers and cleaning. With both in one data layer, usage can be reported by line and shift, and usage per unit of output can be calculated where metering separates the lines. Energy per product is what the data enables; how far it can be taken depends on how the site is metered, which we assess before promising any figure.
Plant services run in the background until they fail or the bill arrives. Boilers, refrigeration, air compressors and hot water sets all report states and values to their controllers. Bringing them into the same screens and reports as production shows run hours, cycling, load and alarms in context, and supports maintenance and replacement decisions with data rather than impressions.
Some of the most useful utility alerts are about when nothing should be using anything. Compressed air flow on a weekend with the lines stopped usually means leaks. Water flow overnight outside a CIP window means a valve or hose left open. We set alarms against expected use for the plant state, so a supervisor hears about it the same day rather than when the next bill arrives.
Utility reports are delivered to the same surfaces as production reports: SCADA screens for the plant, Power BI or Ignition reports for managers, and a periodic pack for the site leader. Sites working toward an energy management program such as ISO 50001 need reliable, contextualised metering data; we build that data layer, and the management system itself stays with the site and its advisers.
Where metering separates the lines or areas that make each product, usage per unit of output can be calculated from the same data as production. We assess the metering first and tell you what the data can support before promising a figure.
Often fewer than expected. Many existing meters have an unused communications port. We add sub-meters only where an area or line cannot otherwise be separated.
Metering can show when air is being used with production stopped, which is the usual sign of leaks, and alarm on it. Finding and fixing the individual leaks is then a maintenance task with an ultrasonic survey.
No. We build the metering and data layer an energy management program relies on. The management system and certification stay with the site and its advisers.
OEE, reports, quality, CIP, maintenance and energy data from the team that builds and programs the lines.
Shift, daily and weekly reports generated from line data and delivered to SCADA, Power BI or email.
The right tag for each count and one meaning for each state, validated against the line and placed in context.
Large capital project delivery across process automation, electrical engineering and commissioning.
Legacy boiler PLC programs migrated to CompactLogix for an OEM, verified through I/O testing and commissioned at end-customer sites.
Fit-for-purpose temperature and cycle control for a hot water set forming and cooking process.
Ignition Gold Certified System Integrator for Ignition SCADA, historian, reporting and MES functions.
Getting PLC and SCADA data into Power BI cleanly: the SQL layer, context and refresh limits.
The unified namespace, MQTT and Sparkplug, OPC UA, historian contextualisation and ISA-95 alignment for a single source of plant truth.
Automation, traceability, CIP, SCADA and production data for Australian food and beverage plants.
Controls for yoghurt and cheese plants, milk receival, pasteurisation, CIP and production reporting.
Chobani needed a controls partner to help establish its Australian manufacturing operation with new production lines and site infrastructure, and the relationship has had to keep adding and optimising lines without disturbing production already running on site. Metromotion Controls supported the initial setup and has continued to add, optimise and support production lines over the years, bringing process, packaging and site services onto common control and data interfaces so each addition extends one operating environment rather than a separate island. The scope spans plant services including boilers, refrigeration, trade waste, power monitoring and water usage monitoring, plus OEE, site data analytics and contextualised production data from lab equipment and other external sources.
Steamtech Engineering is a boiler OEM that installs across multiple end-customer sites, and its boiler automation ran on ageing legacy PLC programs that every new installation inherited. The task was a legacy PLC migration with a goal beyond any one site: the migrated program had to become a maintainable baseline suitable for repeat deployment, not a one-off conversion. Metromotion Controls migrated the legacy code base onto current Rockwell CompactLogix and PanelView platforms, verified the migrated logic against the field through structured I/O testing, and supported commissioning from the OEM workshop through to Steamtech end-customer sites. The result is a more consistent controls baseline across new installations, which is easier for Steamtech and its customers to support.
Patties Foods needed reliable temperature and cycle control for a hot water set process used in forming and cooking cycles. The work had to fit a tight budget, so the scope was kept deliberately lean and every element had to earn its place. Metromotion Controls closed the loop on water temperature and held the forming and cooking cycle timing in PLC logic, so set point and dwell stayed consistent run to run. The result was a focused automation upgrade that improved temperature and cycle consistency for the line.
Factory data, OEE, reports, quality, CIP, maintenance and energy from the team that builds and programs the lines.
Shift, daily and weekly production reports generated from line data and delivered to SCADA screens, Power BI or email, with no typed entries or spreadsheet collation.
Accurate, contextualised plant data built from the right tags and states, validated against the line during commissioning, so reports and dashboards can be trusted.
Ignition SCADA, historian, reporting and MES functions designed, built and supported by an Ignition Gold Certified System Integrator in Melbourne.
Speak directly with an engineer about scope, timing and technical constraints.