Platforms and vendors
- Ignition Reporting
- Ignition Perspective
- Power BI
- SQL databases
- Email and PDF report packs
- Excel exports
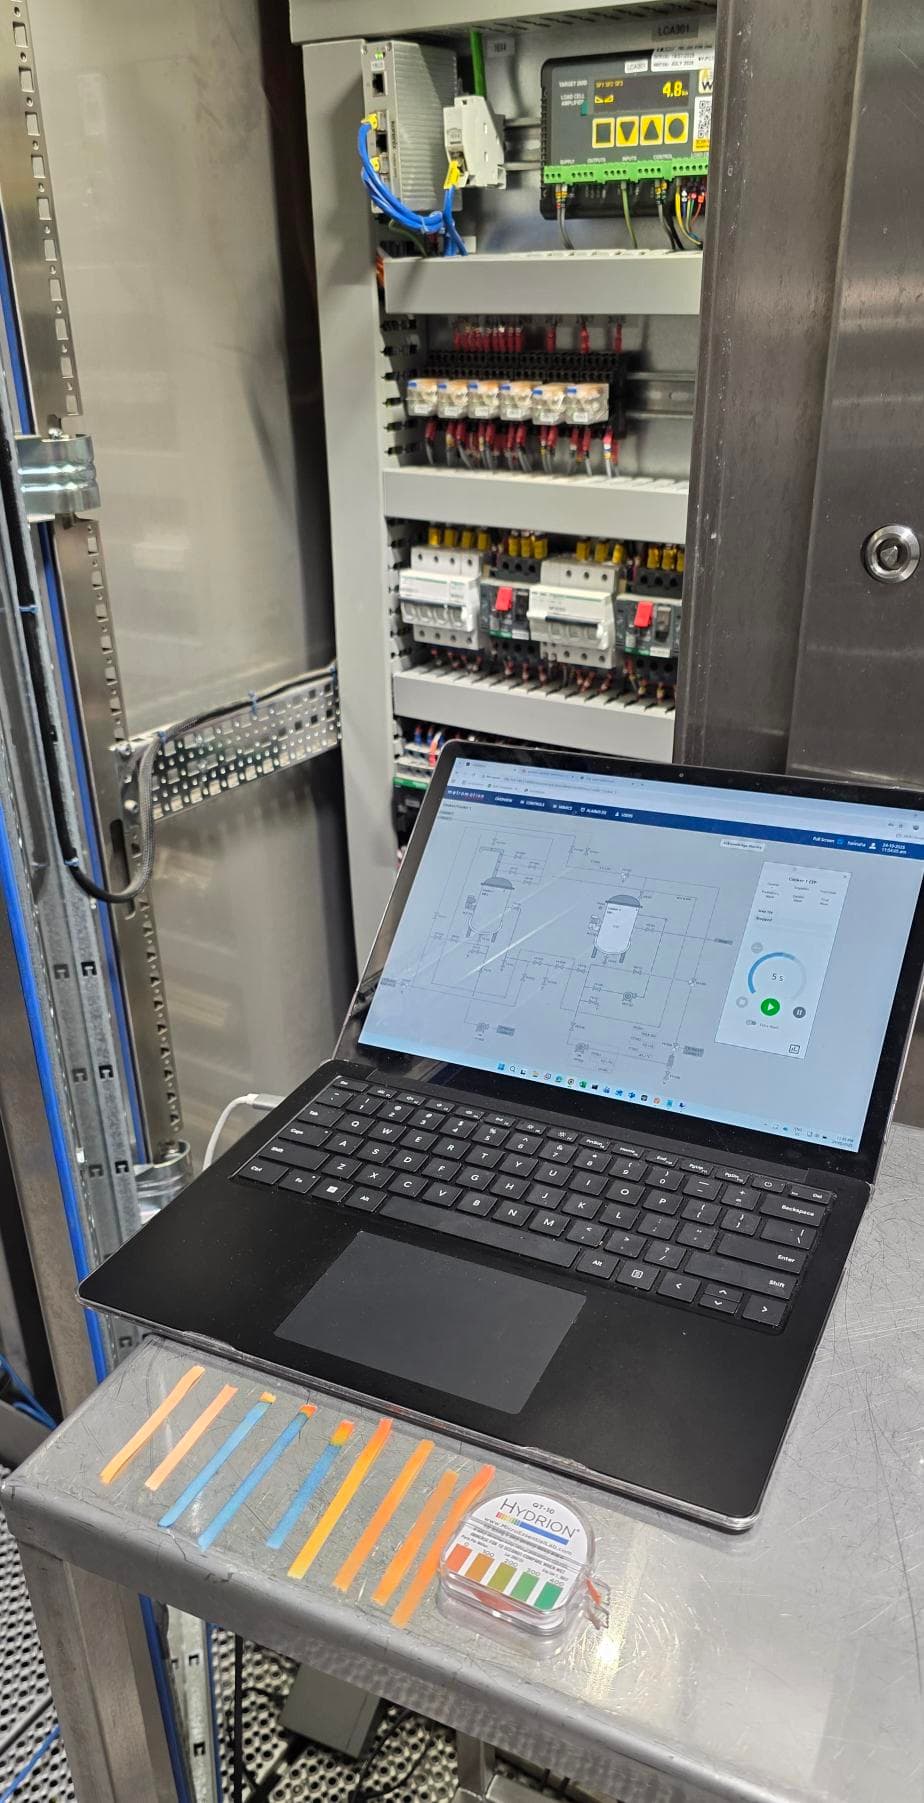
Metromotion Controls builds shift reports, production reports and dashboards from PLC and SCADA data, then delivers them where each team already looks: an Ignition screen at the line, a Power BI report for managers, or an email pack for the site leader.
In many plants the shift report is still a form a supervisor fills in at the end of a long shift, and the weekly pack is a spreadsheet someone assembles on Monday morning. The line already knows most of what goes in both. We generate the report from the data the PLCs and SCADA already hold, check it against what supervisors saw, and send it to the surface each audience uses. At Chobani, shift-level and weekly management reports built this way replaced manual spreadsheet collation and removed re-keying between systems.
Shift-report apps rely on someone typing entries into a tablet. We generate the report from what the line recorded, and ask people only for the notes a controller cannot capture, such as a safety observation or a handover comment. A typical structure is below; each site adjusts it to how its daily meeting runs.
The same data does not belong on the same screen for everyone. We choose the surface by who is reading and how quickly they need to act, and keep every surface fed from one set of numbers so the operator screen and the management pack never disagree.
Power BI is a good fit for managers who already use it for finance and sales. It is a poor place to calculate OEE, because the logic ends up hidden in report formulas that nobody on the plant can maintain. We calculate production figures in the SQL or SCADA layer where the context lives, then publish a clean, documented data set that Power BI reads, with refresh intervals set to what each report actually needs.
The value of an automated report is not the hours saved compiling it. It is that the daily meeting starts with numbers everyone accepts, so the time goes on the top losses rather than on whose spreadsheet is right. Production efficiency improves when the same few losses are reviewed every day with the same definitions, and the report makes that routine easy to keep.
Reports drift when lines change. A new SKU without an ideal rate, a new machine without a stop model, or a renamed tag can quietly distort the figures. We document every calculation, flag missing master data in the report itself, and include report checks in the change process for the line, so a PLC change and its report change are made together.
Yes. Output, rejects, stops, OEE and changeover time come from the line data. Supervisors add only what the controller cannot capture, such as handover notes, and the report is sent or displayed at shift end.
We deliver production data into Power BI as a clean, documented data set with the calculations done upstream, and build the production reports on it where a site wants them there. Power BI is one of several surfaces we support, alongside Ignition screens and email report packs.
Because OEE and downtime rules then live in report formulas that plant engineers cannot see or change. Calculating in the SQL or SCADA layer keeps one definition for every screen and report.
Line screens update within seconds from the SCADA layer. Management reports usually refresh on a schedule, from every few minutes to daily, depending on what the audience needs to act on.
OEE, reports, quality, CIP, maintenance and energy data from the team that builds and programs the lines.
Live OEE, line status and stop reasons read directly from the PLCs on food and beverage lines.
CIP verification and CCP temperature records logged per cycle and per batch, ready for an auditor.
Orders down to the line and counts, consumption, scrap and batch results back to ERPs such as SAP and Pronto Xi.
Getting PLC and SCADA data into Power BI cleanly: the SQL layer, context and refresh limits.
OEE and downtime reporting from PLC states, with shift and weekly management reports for an Australian yoghurt plant.
CIP automation and Ignition platform work for factory automation upgrades.
OEE data platform and line integration for production performance reporting.
Ignition Gold Certified System Integrator for Ignition SCADA, historian, reporting and MES functions.
OEE meaning and calculation under ISO 22400-2, with a worked two-SKU example and the booking rules that move the figure.
Automation, traceability, CIP, SCADA and production data for Australian food and beverage plants.
Machine automation, line integration, OEE data and controls upgrades for high-volume manufacturing sites.
Building on the greenfield automation delivered at Chobani's Australian facility, Metromotion Controls was engaged to develop an OEE data platform that gave the operations team structured visibility of line performance, availability losses, and production output. The project connected existing PLC infrastructure to a centralised reporting environment, establishing consistent downtime reason codes, shift-level OEE calculation, and management dashboards aligned to how the site teams already ran daily reviews.
McCormick is one of the world's largest spice and flavouring manufacturers, with production facilities across Australia. When the team needed to migrate a critical Clean-In-Place system to a modern, maintainable platform, Metromotion Controls delivered a full migration to Ignition SCADA with integrated database, multi-terminal operator access, and a distributed control architecture spanning the facility. CIP systems are production-critical in any flavouring or seasoning environment, and the migration was planned and executed to maintain production continuity throughout.
Cobs Fine Foods is one of Australia's leading premium snack manufacturers. The business needed real-time production data from all line equipment, including checkweigher and metal detector systems, connected to a centralised OEE platform provided by a third-party vendor. Metromotion Controls designed and delivered the automation integration layer, connecting each line asset to Ignition, capturing data at PLC level, and passing it upstream to the OFS OEE platform. The project included full network architecture design, device configuration, and the PLC logic required for clean, consistent data capture across the line.
Factory data, OEE, reports, quality, CIP, maintenance and energy from the team that builds and programs the lines.
Live OEE, line status and stop reasons read directly from the PLCs, shown to operators, supervisors and managers when each of them needs it.
CIP cycle records and CCP temperature and time logs captured automatically from the control system, with pass or fail against the recipe, alarms and signed-off deviations.
Production orders and recipes down to the line, and counts, consumption, scrap and batch results back to ERP, on an ISA-95 model with clear transaction rules.
Speak directly with an engineer about scope, timing and technical constraints.