Platforms and vendors
- Ignition
- Rockwell ControlLogix
- SQL databases
- OPC UA
- MQTT
- PackML
- Power BI integration
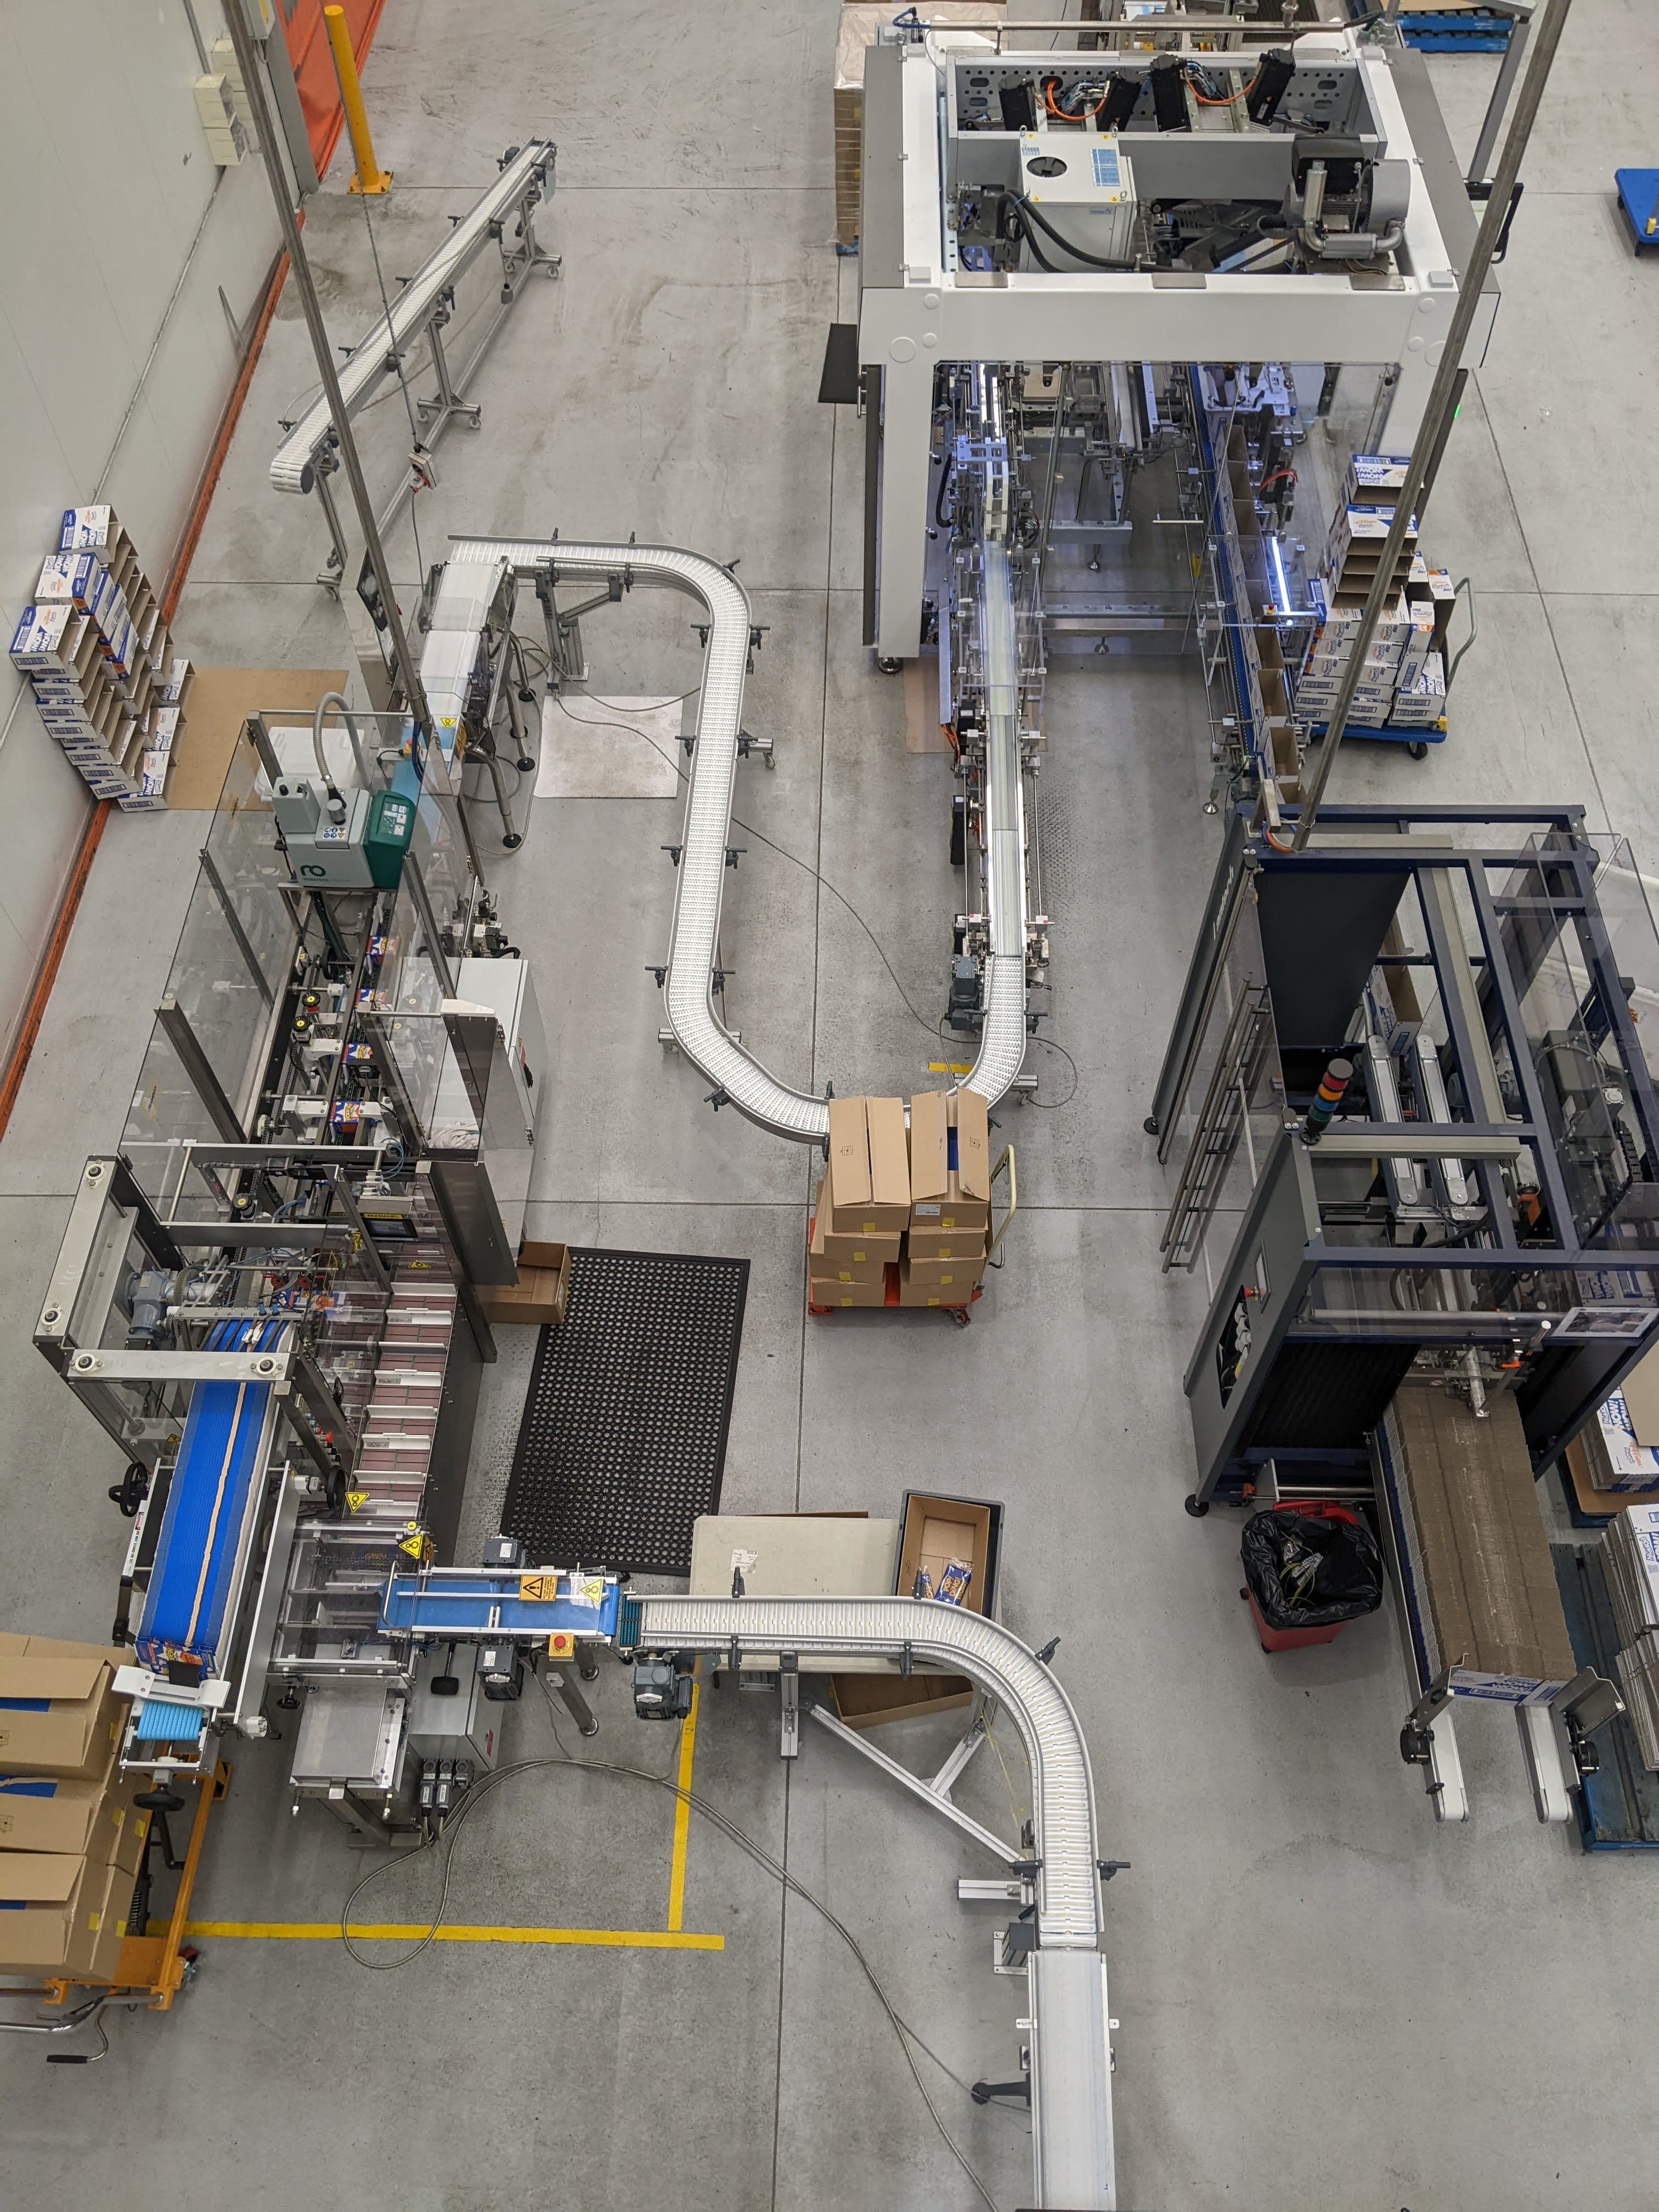
Metromotion Controls builds OEE and production monitoring for food and beverage lines from the PLC states that run them, including lines we built and programmed ourselves, so running state, counts, rejects and stops are recorded the moment they happen rather than reconstructed from a clipboard at the end of the shift.
Most food plants already hold the data they need in their PLCs. Every stop, start, count and reject is registered by the controller the moment it happens. OEE and production monitoring is the work of reading those signals reliably, giving each stop a reason people agree on and putting the result in front of the people who can act on it. Because we write PLC code for a living, we know which tag is the real count, which state means starved and which means faulted, and we build the monitoring on the controls you already run using Ignition, SQL, OPC UA and MQTT where they fit.
A useful monitoring system answers four questions for every line at any moment: is it running, how fast, what is it making and, if it is stopped, why. Everything else, including OEE, is built from those answers.
Real-time data is only useful if it reaches the person who can act on it while acting still matters. We design the views by role and by time, so the operator is not handed a management report and the plant manager is not asked to watch a line screen all day.
Manual downtime sheets miss short stops, round durations to the nearest few minutes and assign reasons from memory at the end of a shift. The controller does not have that problem. When a filler stops on a low-level interlock or a capper faults, the PLC registers the state change immediately. We map those states and fault bits into one consistent stop model for each machine, so every stop is timestamped and attributed automatically. On lines we built, the stop model follows the logic we wrote. On other lines, we read the code before we trust a signal. Operators are asked only for what the PLC cannot know, such as why the line was waiting on product, and they choose from a short reason list at the HMI instead of writing it down later.
Downtime data is only useful if the weekly review stops arguing about it. That depends less on software than on a reason-code list that production, maintenance and engineering have agreed. We keep the list short and two levels deep, write down the rules for what counts as planned and unplanned time, and decide early how changeover, CIP and allergen cleans are booked, because on a multi-SKU food line those windows are often the largest losses. At Chobani, consistent reason-code definitions across shifts gave the operations team a Pareto they could use in daily reviews.
Overall Equipment Effectiveness, or OEE, is Availability multiplied by Performance multiplied by Quality, following the ISO 22400-2 definition of the measure. It expresses how much of the planned production time turned into good output at the ideal rate. A single number is only useful when each line counts time the same way, so the harder part is defining machine state consistently across mixed-OEM equipment. We use PackML state models and PackTags where the OEM supports them, so a stop on a filler from one vendor and a stop on a capper from another are recorded against the same definitions, and each SKU carries its own ideal rate so a slow product does not look like a slow line.
The usual path reads the line PLCs from a data server over native drivers or OPC UA, records state changes and counts as events in a SQL database, and serves screens and reports from the same platform. Ignition is a common choice because one gateway covers data collection, storage, screens and reporting. Where a signal is not in a PLC, such as vibration on a filler, a small edge device publishes it over MQTT, as we did on the Remedy Drinks can filler. The data path stays read-only from the control layer and sits on a segmented OT network, so monitoring cannot change how the line runs. If the site already has a third-party OEE platform, the same layer can feed it, which is how the Cobs Fine Foods lines were connected.
We scope and price each site after a short review of its lines, PLCs and network, because the spread between plants is wide. The drivers are predictable, though, and most of them are visible before any work starts. The quickest path is one line first: prove the stop model and reason codes on a single line, have supervisors use it in their daily review, then roll the proven pattern to the next lines. Most of the effort goes into validating signals and agreeing reason codes, not into building screens.
Subscription monitoring apps are quick to trial, and some sites use them well. Many rely on operators tagging stops on a tablet or on add-on sensors that count output, which brings back the manual-entry and missing-context problems. A PLC-connected system reads the state the controller already knows, including the fault that caused the stop, and keeps the data in a database the site owns. The two are not exclusive: we can feed an existing OEE platform with clean PLC data, as on the Cobs Fine Foods lines, so the platform finally has signals it can act on.
Yes. Monitoring reads the PLCs already on the line. Where a machine does not expose a usable state or count, we add the smallest change needed, such as a mapped status word or a counter, under the site change-control process.
Only what the controller cannot know. Stops, durations, counts and machine faults are captured automatically. Operators choose a reason from a short list at the HMI when the cause is outside the machine, such as waiting on product or labour.
We agree the rules with production. A common set is an operator prompt at the HMI for every stop, a supervisor alert on a phone when a line is down longer than an agreed limit, and a daily report by email or in the reporting tool for managers.
We price each site after reviewing its lines, PLCs and network. The main cost drivers are whether the signals already exist in the PLC, how many machines and OEMs are on each line, network readiness, whether a SCADA platform is already in place, and how many lines go live in the first stage.
No. The data path is read-only from the control layer, polling rates are set so they do not load the controller, and the data server sits on a segmented OT network. Any PLC logic change needed for data capture goes through site change control and is tested before use.
Yes. At Cobs Fine Foods we connected every line asset to Ignition at PLC level and passed the data to a third-party OEE platform, giving operations real-time line performance visibility.
OEE, reports, quality, CIP, maintenance and energy data from the team that builds and programs the lines.
The right tag for each count and one meaning for each state, validated against the line and placed in context.
Shift, daily and weekly reports generated from line data and delivered to SCADA, Power BI or email.
OEE meaning and calculation under ISO 22400-2, with a worked two-SKU example and the booking rules that move the figure.
How availability, performance and quality are actually calculated, and why source-of-truth machine data matters.
OEE and downtime reporting from PLC states, with shift and weekly management reports for an Australian yoghurt plant.
OEE data platform and line integration for production performance reporting.
MQTT-based vibration and condition monitoring with threshold alerting on a production-critical can filling line.
Ignition Gold Certified System Integrator for Ignition SCADA, historian, reporting and MES functions.
Plant events that raise CMMS work orders, condition alerts before a stop, and runtime counts for preventive maintenance.
Automation, traceability, CIP, SCADA and production data for Australian food and beverage plants.
Machine automation, line integration, OEE data and controls upgrades for high-volume manufacturing sites.
Conveyor and line control, PackML-aligned states, changeovers, inspection and packaging OEE data.
The OMAC PackML state model and unit modes, PackTags, ISA-TR88.00.02 and using PackML states to drive accurate OEE on packaging lines.
Condition monitoring to ISO 17359 and ISO 13374, the P-F curve, MQTT and OPC UA data acquisition, and how condition data ties into OEE.
Building on the greenfield automation delivered at Chobani's Australian facility, Metromotion Controls was engaged to develop an OEE data platform that gave the operations team structured visibility of line performance, availability losses, and production output. The project connected existing PLC infrastructure to a centralised reporting environment, establishing consistent downtime reason codes, shift-level OEE calculation, and management dashboards aligned to how the site teams already ran daily reviews.
Cobs Fine Foods is one of Australia's leading premium snack manufacturers. The business needed real-time production data from all line equipment, including checkweigher and metal detector systems, connected to a centralised OEE platform provided by a third-party vendor. Metromotion Controls designed and delivered the automation integration layer, connecting each line asset to Ignition, capturing data at PLC level, and passing it upstream to the OFS OEE platform. The project included full network architecture design, device configuration, and the PLC logic required for clean, consistent data capture across the line.
The can filling line at Remedy Drinks is a production-critical asset. Unplanned downtime on the filler directly affects output and shelf availability. Metromotion Controls was engaged to implement a condition monitoring solution that captured vibration and operational data from the can filler, providing the maintenance team with early indicators of developing faults. The solution used an MQTT-based data collection architecture to feed condition data into Ignition, where it was trended and threshold-monitored alongside production events.
Factory data, OEE, reports, quality, CIP, maintenance and energy from the team that builds and programs the lines.
Accurate, contextualised plant data built from the right tags and states, validated against the line during commissioning, so reports and dashboards can be trusted.
Shift, daily and weekly production reports generated from line data and delivered to SCADA screens, Power BI or email, with no typed entries or spreadsheet collation.
Ignition SCADA, historian, reporting and MES functions designed, built and supported by an Ignition Gold Certified System Integrator in Melbourne.
Speak directly with an engineer about scope, timing and technical constraints.